and each will give their unique perspective on the business and what they do to support the strategic objectives of the business.
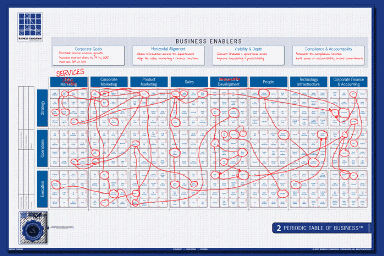
Each meeting ulilizes a complete set of 5 sheets including sheet 2 - The Periodic Table of Business. This is effectively where we wipe the slate clean and look at the true requirements of the business in relation to executing upon the strategic goals. Whilst some focus is given to current and past situations, much of the focus of the discussion is given to how best to move forward and execute on the plans of the business.
This is where we discuss the business in a very interactive manner, using the "Broadsheets" as a way to document the conversation as well as find the Performance Markers or drivers that drive or connect to the strategic objectives.
There's no PowerPoint here.
We use the traditional method of documenting which is pen and paper.
We have historically found that by creating a more personal environment, condusive to open and honest conversation and dialog, productivity and results increase significantly.
After each session, the sheets are consolidated and common themes start to emerge. Clearly seen are the connections across and down the business that drive the strategic objectives.
In the illustration above, you'll see the Periodic Table of Business sheet, (sheet #2) with various Performance Markers circled and in turn connected.
You'll notice that these connections, or "Lines of Sight" as we call them, extend across the business and deep into the various hierarchical layers. This suggests that to execute just the most simple set of strategic objectives, many areas of the organization must be involved in tracking and monitoring these performance markers. We look at the performance Markers that drive strategic objectives, then look at the people who help to drive them, the xPM processes that give structure and validation to the execution of the drivers.
At the end of the Executive interviews in the Organizational Focus & Strategy Alignment Stage, what you are left with is the 'business' documented list of requirements, where they exist in the business and who needs to get involved.
The Business Intelligence Blueprints serve organizations in four key areas;
- Allowing focus & strategy alignment across and down the organization
- Creating a Business Intelligence Road Map that can be used by the business to communicate solutions and systems requirements to IT
- A clear, transparent process of documentation and alignment for Business, IT and Finance alignment
- A way to manage the critical company-wide metrics in a logical, cross-functional and business centric manner
Organizational Focus & Strategy Alignment is the initial phase where we sit down with all the key members of the client's management team, typically for 2 hour interview sessions using our alignment methodology. Each business function is usually represented in these separate meetings
BUSINESS INTELLIGENCE BLUEPRINTS
Want to know more?
Click here to see a short presentation
managed through the Business Foundation xPM cycle
METRICS MANAGEMENT
The process of managing and visualizing the most important drivers and metrics in the business can be complex.
The drill-paths, or identification of the drivers of the drivers, so to speak, is not as simple as looking at the P&L which is what most companies do.
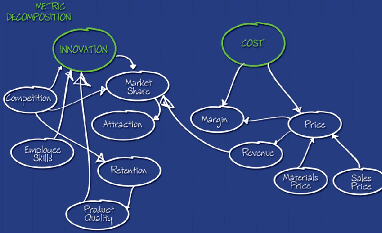
You'll see in the very simple illustration below that you have to think about both direct and in-direct drivers of the bussiness in order to really get to who, what, when and how people need to track drivers of value in the business that help achieve the strategic goals.
Lift-off initiatives are the plan, initiative and ultimate realization of what was discovered in the Organizational Focus & Alignment stage. It's where the rubber really hits the road.
This is where we take all the Broadsheets that have been filled in with the different participating executives and consolidate them up into common themes. These common themes may consist of several Performance Markers that are key drivers of the strategic objectives. These then, and the other performance markers that drive them, are the areas where the business needs to focus.
But, to try to execute on all these initaives at the same time would prove challenging, if not impossible. Therefore, we recommend doing 1 at at time, at least at first. This is the start of a comprehensive, yet quickly executable, initiative that can help bring focus in the business to an area that directly drives a strategic objective and therefore hits the bottom line positively. The Business Foundation brings to this process a whole methodology of taking each initiative and helping to work through the people, processes and technologies that will make it possible.
We take into account the roles of people in each intersection, the performance markers that need to be tracked and more importantly, the technologies that will enable each Performance Marker to be
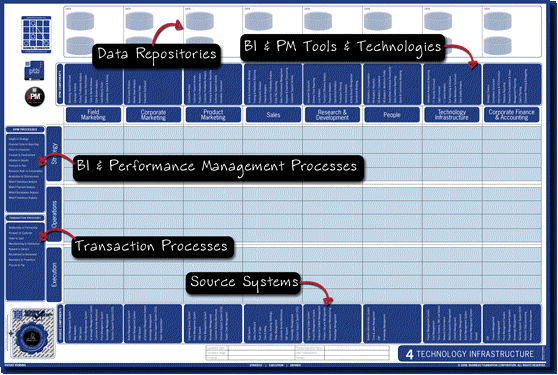
Now focus needs to be directed to what systems, (technologies) need to be matched to those people, (role-based Business Intelligence and Performance Management) in order to sustainably execute upon the company's objectives. This is where the Business Intelligence Roadmap comes into play. Together with the Broadsheets that document the conversations, we marry those with a final Technology Infrastructure sheet. This process ensures the appropriate Business, IT and Finance Alignment.
This shows the source systems that feed the performance markers captured, the processes that keep the information going and the ultimate tools and technologies that need to be be implemented, (or adjusted if already in place) to accommodate the new requirements, laid out by the business.
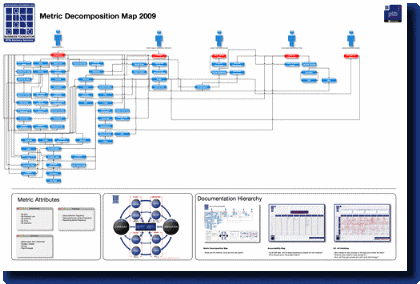
Our practitioners use our methodology to prepare what we call a Metric Decomposition Map for your business. This is a Map of the top metrics of value that directly drive strategic objectives and all the resulting underlying drivers. All the interconnections across the business are also seen, (these come out of the Periodic Table of Business).
What we then end up with is the definitive system map for IT to build BI and PM systems from. No more will IT have to ask the business exactly what they want to see. It's in the decomposition map
GEOGRAPHY
The next step from the Metric Decomposition Map is to add geography. That is to say, who, and where are the people that need to have visibility to the drivers we have illustrated on the Metric Decomposition Map?
We add that geography and system information with you. You also receive our Accountability maps which gain agreement with the Executive team, who is actually responsible for the critical data in the business.
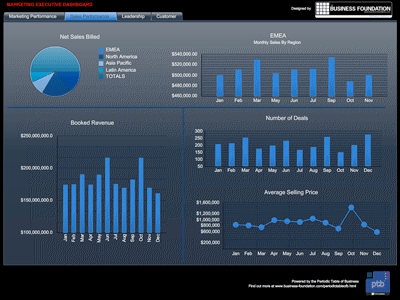
Finally, we can help you prototype the Executive information systems to give the main stakeholders a good idea of what will be produced.
This gives IT and the business time to tweak the visualization of the key drivers prior to final release.
Metrics Management is a key part of running your business, but one that seems to harbor a good deal of controversy and disagreement. Using our Business Intelligence Blueprint methodology as a starting point, you'll get agreement and buy-in
from the start.
- Proven methodology to allow focus on the right drivers
- Clear audit trail back to what the business said
- A platform from which IT can build the right information systems
- Can be used as a 'Metrics Audit'
![]()
